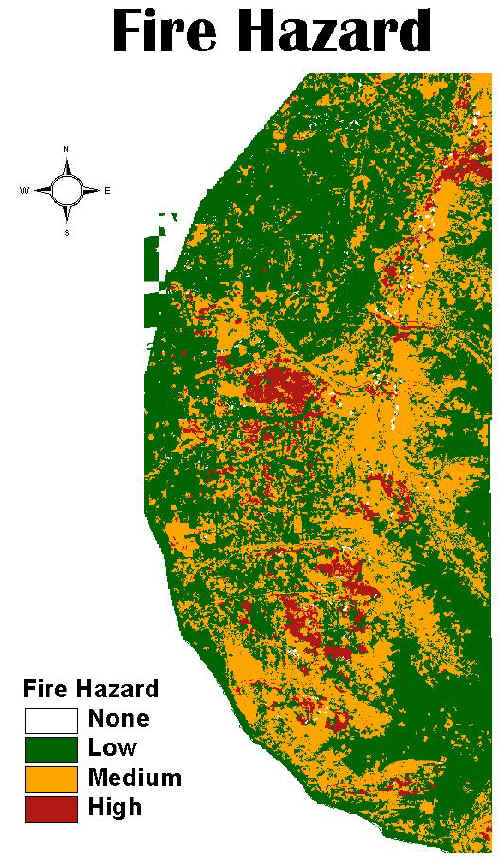
The map below shows the areas with the highest probability of major wild-fires highlighted in red. To produce that they fed a bunch of different data into a GIS such as:
1. Areas of the forest that have mixed hardwood and conifer trees. This combination burns very well.
2. Areas that have an infestation of the spruce bark beetle. They kill spruce trees, and the resulting dead trees are excellent fire starters.
3. Areas that would take firefighters more than an hour to reach because of terrain and distance.
4. Lack of a water supply nearby.
5. Topography. Fire spreads much faster going up hill that across flat terrain. (This one in particular is interesting to me from a GIS perspective.)
6. Areas of dry foliage and dead grass.
Feed all of that to the GIS in just the right way, and you get this map to help the planners optimize where they should station their firefighters; where they should spend money on additional resources; where to post fire hazard warnings for campers, hikers, etc.
Part of the reason I am posting this kind of stuff here is that I don't have a good answer when friends and family ask what GIS is or what can you use it for. Having some real-world examples should help.
No comments:
Post a Comment